Personal loan calculator Estimate monthly payments, total interest, and payoff timeline. Adjust term and rate to see how your costs change before you apply.
Personal loan calculator
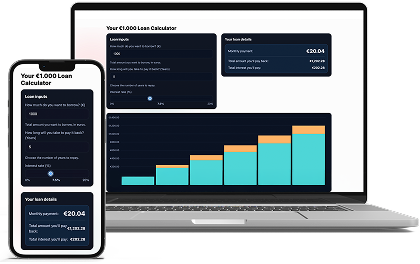
What a €1.000 loan could look like
See the full picture before you apply. We estimate costs with the same math as the calculator and highlight the figures that matter.
We’ll check your credit to set a personal rate and confirm an affordable limit. Our sharpest rates start from 5.99% for top credit tiers.
Example now: borrow €1.000 for 60 months at a fixed 7,5%.
- Estimated monthly instalment: €20,04
- Total to repay across the term: €1.202,28
- Effective annual percentage (APR, monthly compounding): 7,8%
Figures are estimates; your offer may differ based on checks and fees.


Clear monthly payment
See principal vs. interest over time and plan an affordable budget.

Flexible terms
Shorten the term to cut interest — extend it to lower the monthly cost.

Built for speed
Simple, responsive, accessible. No clutter — just the numbers you need.
Quick Loan Cost Calculator
Most calculators dump numbers on you and move on. This one tries to tell a story. You give it three simple facts – how much money is involved, how long you have, and what rate applies – and it turns those into the answers you actually need: the monthly payment (for borrowing) or the future total (for saving), how much is interest, and how the picture changes year by year. Under the hood there’s careful math, but you don’t need to see it. Think of the tool as a simulator that plays the same simple rhythm over and over: update the balance, count the month, draw the line, repeat.
What is it Loan Calculator?
The Quick Loan Cost Calculator is a fast, no-nonsense tool that turns three simple inputs - how much you want to borrow, how many years to repay, and the interest rate - into clear answers. It instantly shows your fixed monthly payment, the total you’ll repay over the term, and how much of that total is pure interest. A cumulative chart visualizes progress over time, revealing how early payments are interest-heavy and later payments eat more principal. Designed to be lightweight and accessible, it updates as you type so you can test “what-if” scenarios in seconds. Use it to compare terms, sense the impact of small rate changes, and choose a plan that fits both your monthly budget and long-term costs.
Loan Lingo, Decoded: Your Calculator Glossary
- Amount to borrow (€): The principal — the cash you receive on day one and the starting balance the loan is based on. Interest is calculated from this amount and shrinks as you repay.
- Years to repay: The loan term — the total length of the agreement, expressed in years. It determines how many monthly payments you’ll make.
- Interest rate (%): The lender’s yearly price for borrowing. It sets how large the interest portion of each monthly payment is at any point in time.
- Monthly payment: The fixed amount due each month. It always covers that month’s interest first, with the remainder reducing the principal.
- Total amount you’ll pay back: The sum of all monthly payments over the full term. It’s the complete out-of-pocket cost of the loan.
- Total interest you’ll pay: The price of borrowing over time — total paid minus the amount you borrowed. Lower rates or shorter terms reduce this figure.
- Amount borrowed paid back (chart): The cumulative principal you’ve repaid up to each year, shown as the lower (cyan) stack. It tracks real progress on reducing the debt.
- Interest paid (chart): The cumulative interest you’ve paid up to each year, shown as the upper (orange) stack. It grows fastest early on and slows as the balance falls.
- Loan repayment chart: A stacked, cumulative year-by-year view of your journey. It visualizes how principal repayment accelerates while interest growth tapers over time.